Hypothetical clinical study to determine whether the S&T swing increases the risk of chronic back problems
Click here to go to the index page.
Consider the situation of a clinical researcher, who wants to determine whether the S&T swing increases the risk of chronic back problems.How would the clinical researcher design a clinical study to achieve this goal?
The first point that a layperson needs to understand is that one of the fundamental principles of clinical research is the basic requirement that a researcher needs to make an unbiased comparison between two groups of study participants. To determine whether the S&T swing increases the risk of chronic back problems over the long-term, one needs to know the baseline rate of chronic back problems in the general population of golfers, who use a traditional swing (and not the S&T swing). Therefore, when designing the clinical study, the researcher has to recruit two groups of study participants - a group of traditional golfers and a group of S&T golfers, who are equally matched (balanced) in terms of age and general health. Let's call the group of traditional golfers the old group, and the group of S&T golfers the new group.
In designing the clinical study, the researcher has to formulate the i) sample size of each study group, ii) the baseline clinical characteristics of the study participants, iii) a defined clinical endpoint, and iv) the study duration.
The required sample size is the number of study particpants who are recruited into the study (and who succesfully complete the study), and the sample size must be sufficiently large to produce a scientifically conclusive result.
Regarding the the clinical characteristics of the study participants, they must be young and healthy and free of back problems, and free of any known genetic/enviromental predisposition to developing back problems.
The defined clinical endpoint would be back problems that are related to the lumbar spine (eg. lumbar facet joint osteoarthritis, degenerative lumbar disc disease), and that are not due to other diseases causing back pain, and the severity of the back problems must be severe enough to prevent a golfer from playing golf regularly.
A golfer, who starts to play golf regularly at the age of 15 years, would presumably want to continue to play golf until he is 75 years old, and he would want to know that he can play golf regularly for 60 years without any increased risk of developing chronic back problems. The human spine is very resilient, and because it takes many years of biomechanical abuse to produce chronic back pathology, the study duration should optimally last 40 years (and a minimum of 30 years). To decrease the likelihood of the study participants already having back problems, it would be optimal to enroll young golfers who are between the age of 18-25 years of age. The old group and the new group would also have to be balanced in terms of the total number of full golf swings they perform each year, so that the study doesn't doesn't become biased (scientifically compromised) by the fact that the two groups are not subjecting their lumbar spine to the same level of golf swing stress each year.
Let's presume that a clinical researcher can enroll a large pool of young golfers, who are willing to participate in the study for a time duration of 40 years - how many study participants would the researcher have to recruit in order to produce a scientifically conclusive result?
The definition of a scietifically conclusive result requires a layperson to first understand the manner in which clinical study results are reported and analysed.
The old group of study participants represents the control group, and one would want to determine their average rate of developing chronic back problems over the time duration of the study (40 years). Let's presume that 3% of old group study participants develop chronic back problems after 40 years. That 3% figure represents the control event rate (CER).
Then, one would need to determine the average rate of developing chronic back problems in the new group - this rate is called the experimental event rate (EER). If the average rate of developing chronic back problems is higher in the new group, a clinical researcher will then want to determine whether that increased rate is clinically significant. The definition of "clinically significant" is arbitrary, because each individual golfer will have to ultimately decide whether the increased risk of developing chronic back problems is worth the risk (in terms of the likely benefit of using the S&T swing - using a swing style that may be easier-to-learn and master, and that may more consistently result in solid ball striking). For example, if the study determines that the increased risk of developing chronic back problems in the new group (S&T group) is increased by 50% (50% represents the relative risk increase) from a CER of 3% to an EER of 4.5%, a golfer (who views the study's results) might decide that the absolute increase in risk is not clinically significant (too small to be worth the worry), and he may decide to use the S&T swing. However, let's presume that the absolute increase in risk is large enough to be clinically significant, then a prudent golfer may decide that it is safer to use the traditional golf swing. So, for argument sake, let's define a 3x-fold increase in absolute risk (equivalent to a 200% relative risk increase) as being clinically significant, then the experimental event rate in the new group would have to be 9% to be clinically significant.
How many study participants must the clinical reseacher enroll in the study to produce a scientifically conclusive result if the anticipated CER is 3% for the old group, and the anticipated EER is 9% for the new group?
To answer this question, a clinical researcher will use a Clinical Trial Simulator tool [1].
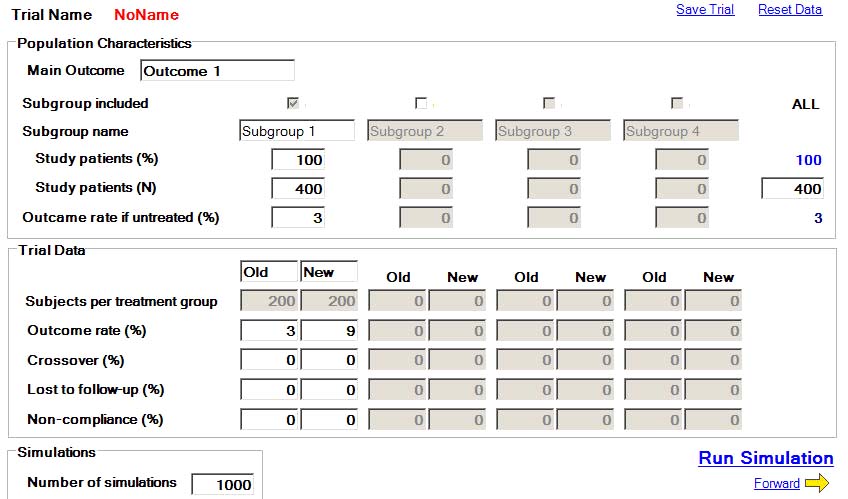
Here is the first page of the clinical trial simulator's program.
Under population characteristics, the clinical trial researcher will input the number of study participants enrolled in the trial. In this trial, the researcher has enrolled 400 golfers - 200 traditional golfers for the old group and 200 S&T golfers for the new group.
Under trial data, he will input the anticipated CER of 3% for the old group, and the anticipated EER of 9% for the new group. We will presume that the crossover rate is zero - that no golfer changes from being a traditional golfer to a S&T golfer (or vica versa) during the study time period. We will also presume that all study particpants complete the study and are not lost to follow-up, and we will also presume that the non-compliance rate is zero (that all study participants complete roughly the "same" number of full golf swings/year).
Under "number of simulations", the researcher inputs a number of 1,000 and then clicks the "run simulation" button. Then, the software program will run the hypothetical trial 1,000x and report the results as follows.
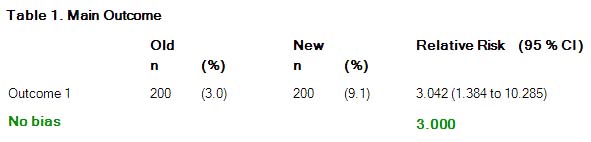
"n" stands for the number of study participants in each group, and the % represents the CER of 3.0 % (for the old group) and the EER of 9.1% (for the new group).Note that the study result is reported as a relative risk value of 3.042 with a 95% confidence interval of 1.384 to 10.285.
Relative risk (RR) = EER/CER = 9.1% divided by 3% = 3.042 (and that RR value represents the absolute increase in risk of the new group golfers developing chronic back problems over the study period of 40 years).
What's a 95% CI? This where the explanation becomes more complicated.
This trial was run 1,000x by the Clinical Trial Simulator program, and it collected the RR results from those 1,000 simulated trials - 95% of those RR results fell within the RR range of 1.394 and 10.285.
If the "true" RR value is 3.0 (labelled the "no bias" RR value - see green value above), why is the spread of simulated trial RR results so large - 950 of the 1,000 simulated trials produced RR values that fall within a wide RR range of 1.384 to 10.285.
The answer relates to the fact that when running a clinical trial, one cannot be certain that the control group participants and the experimental group participants have exactly the same average baseline risk of developing the clinical endpoint (chronic back problems) during the study time period (40 years). "Chance" plays a huge confounding role in clinical trials. There is always a chance that the control group recruited patients who had a larger (or smaller) baseline risk of developing chronic back problems over a 40 year time period than the experimental group - and that chance event could bias the trial's results. If, by chance, the control group happens to enroll study participants who have a lesser average baseline risk of developing chronic back problems than the experimental group, then that would bias the trial's results against the experimental group - it would make the S&T swing "appear" to be more harmful than it really is (presuming the "true" RR is 3.0) and one could get a biased RR result of >3.0. If, by chance, the control group happens to enroll study participants who have a greater average baseline risk of developing chronic back problems than the experimental group, then that would bias the trial's results in favor of the experimental group - it would make the S&T swing "appear" to be less harmful than it really is (presuming the "true" RR is 3.0) and one could get a biased RR result of <3.0. The 95%CI range implies that a clinical researcher has a 95% certainty of getting a RR result that could be as low as 1.384 or as high as 10.285 - even though the "true" RR value is really 3.0 - if his baseline CER is only 3% and his sample size is only 400 study particpants. This is a very disconcerting "reality check" for a clinical researcher - the realisation that one's individual trial result may not identify the "true" RR value. In other words, there is significant chance that the clinical study could be grossly under-estimating, or grossly over-estimating, the risk of a S&T golfer developing chronic back problems, and the width of the 95%CI gives one a true appreciation of the possible magnitude of an incorrect estimation. When assessing an individual trial's RR result, the wider the 95%CI the less scientifically-conclusive the trial's result; and the narrower the 95%CI the more scientifically-conclusive the trial's result. In other words, to get a more scientifically-conclusive result (a RR value that is more likely to be very close to the "true" RR value of 3.0) one will want to narrow the 95%CI range - and that statistical requirement mandates that a clinical researcher increase the sample size (because one cannot alter the average baseline CER of 3%).
So, consider the effect of increasing the hypothetical study's sample size from 400 study participants to 4,000 study participants (2,000 traditional golfers and 2,000 S&T golfers). If one runs the Clinical Trial Simulator program again (using a sample size of 4,000 trial participants; an anticipated CER of 3%, and an anticipated EER of 9%) this would be the result of 1,000x simulated trials.
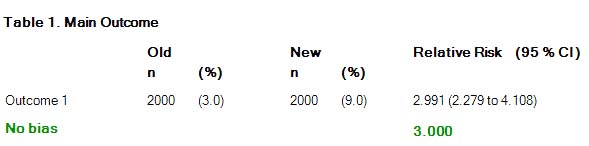
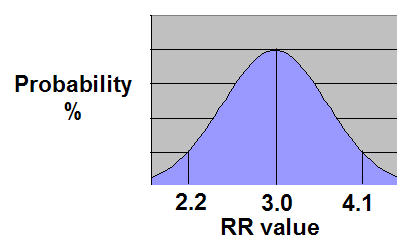
Note that the average RR value was 2.99, and the 95%CI range was narrower - ranging from 2.279 to 4.108.
That's a more scientifically-conclusive result because it narrows the range in which the "true" RR value can be found. The "true" RR value can be perceived to be either as low as 2.2 or as high as 4.1, but the likely "true" RR value is going to be close to 2.99.
If one plots the RR values of those 1,000x simulated trials, their results will produce a bell-shaped curve.
The 1,000x RR values are plotted on the X-axis, and the "probability of obtaining of a specific RR value" is plotted on the Y-axis.
One can readily see that the probability of an individual clinical trial getting a RR value close to the "true" value of 3.0 is greater than the probability of getting a RR value closer to 2.2 or 4.1.
All these facts reflect the reality of clinical science. The degree of scientifically-conclusiveness of a clinical study has to be understood in terms of probability, and the narrower the range of probabilities for the final result, the more scientifically-conclusive the study's result.
A layperson may be surprised to learn that it would take such a large sample size to obtain a scientifically conclusive result, but he needs to understand that there are two major reasons for that fact - a low baseline CER of only 3% and a RR value of moderate size. The only way that a researcher could get away with a smaller sample size in this scenario is if the likelihood of chronic back problems in S&T golfers is much greater than a RR value of 3.0 - and the likelihood of that scenario is presently unknown because no researcher has studied this issue.
Another confounding factor that complicates matters when designing a hypothetical study of S&T golfers
In this hypothetical study, one has to divide golfers into two groups - traditional golfers and S&T golfers. To get a scientifically valid result, the two groups must be clearly distinguished in terms of their golf swing characteristics, and one would not want to enroll equivocal cases.
For example, many golfers believe that they are using the S&T swing, but I believe that they are not fulfilling Bennett/Plummer's strict criteria for a S&T swing.
Consider what represents a S&T swing.
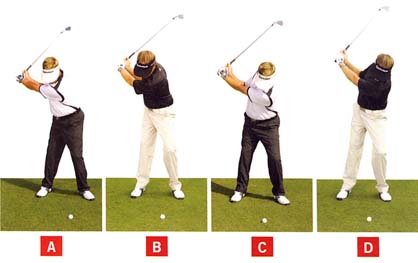
Bennett/Plummer use the following photo-diagram in their book to demonstrate the left-leaning characteristic of the end-backswing posture of a S&T golfer.
End-backswing posture of 4 golfers - from reference number [2]
The traditional golfer is best represented by photo B and the S&T golfer is best represented by golfer C. Golfers A and D are too extreme, and they do not represent either a traditional golfer or a S&T golfer, and they should not be enrolled in the study. However, what about a golfer who is intermediate between golfer B and golfer C - a golfer who has a vertical posture (not left-leaning or right-leaning) at the end-backswing position.Consider David Orr's swing - http://www.youtube.com/watch?v=Jz9xyzHH_bs
David Orr, a golf instructor, labels himself as a S&T golfer. However, I do not believe that he qualifies as a S&T golfer for a number of reasons - i) He does not lean left at the end of his backswing - his spine is simply vertically aligned. ii) Secondly, he rotates his pelvis in the downswing and he doesn't use the aggressive left-lateral thrust action that is characteristic of a S&T golfer. I think that David Orr is simply a traditional golfer, who keeps his spine vertical during the backswing by using certain elements of the S&T swing.
Here is another example of a golfer who labels himself as a S&T golfer.
Jason Zuback - http://www.youtube.com/watch?v=Izmb_3F0y88
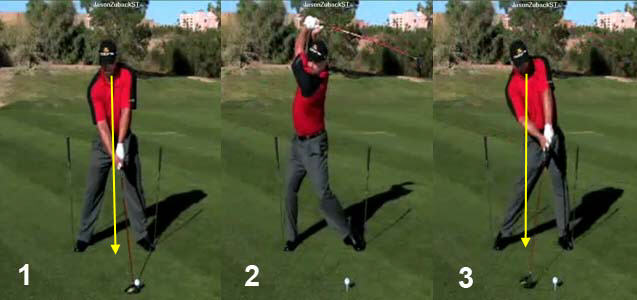
Jason Zuback's driver swing - capture images from his swing video
Image 1 show Jason Zuback at address. Note that his pelvis and spine are centralised and he does not have more weight over the left foot (yellow arrow shows the vertical location of his upper swing center) as should occur in a S&T swing.Image 2 shows Jason Zuback at the end-backswing position. Note that he has three charactertics that are not found in Bennett/Plummer's S&T swing model - i) his pelvis sways to the right; ii) his right knee is flexed; and iii) his right pelvis is lower than his left pelvis. Jason Zuback actually has the traditional golfer's pelvic action, but he simply latriflexes his thoracic spine leftwards so that he appears to be left-leaning (like a S&T golfer).
Image 3 shows Jason Zuback at impact. Note that he is allowing his upper swing center (shoulder center) to move rightwards as he develops a large degree of rightwards spinal tilt by impact - and that secondary axis tilt is not solely due to an aggressive left-lateral pelvis shift action. It is partly due to tilting his upper torso rightwards during the downswing. Also, note that the outer border of his pelvis is well within the outer border of his left foot, and that is not characteristic of a S&T swing.
Jason Zuback may be a reverse-pivoting golfer, but he is not performing the S&T swing as strictly prescribed by Bennett/Plummer [2].
Golfers, like David Orr and Jason Zuback, should not be enrolled in the group of S&T golfers in a clinical study. Many golfers have a limited number of S&T swing characteristics, but they should not be included in the sample group of S&T golfers if they do not have all of the essential S&T swing characteristics that allow a S&T golfer to keep the upper swing center (shoulder center) stationary throughout the entire swing (backswing, downswing and followthrough).
Considering all these complex enrollment/statistical factors, I think that it is very unlikely that any researcher will undertake this type of hypothetical study, and the question whether the S&T swing increases the risk of chronic back problems (and to what degree it increases that risk) will likely remain a mootable question.
References:
1. Clinical Trial Simulator tool.
Downloadable from http://randomization.org
2. The Stack and Tilt Swing. Mike Bennett and Andy Plummer.